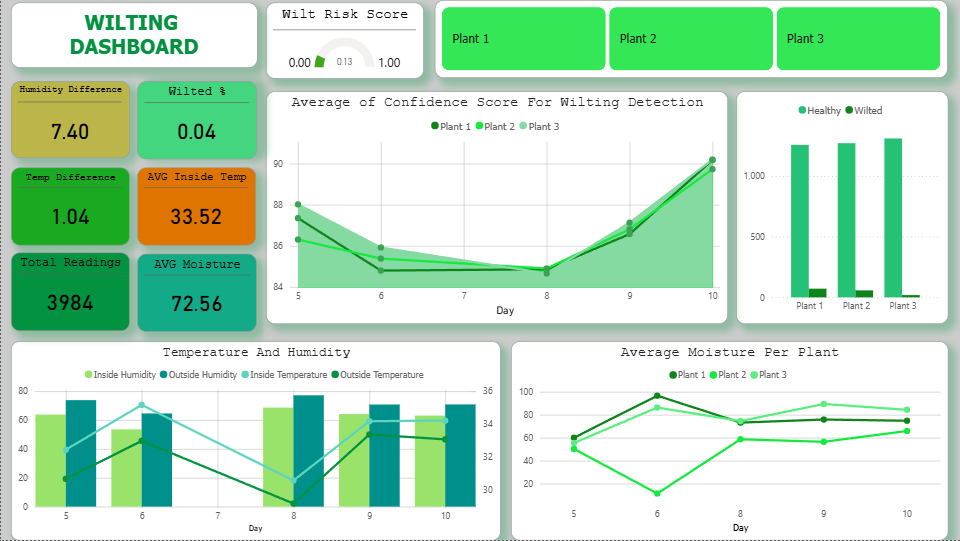
My First End-to-End Power BI Dashboard: Plant Wilting Detection
How I took sensor data stored in SQL Server, built a flat table schema, wrote DAX measures, and created a live Power BI report that tracks plant health in real time.
I build end-to-end data solutions—from ingesting and transforming raw data to delivering analytics dashboards and actionable insights.
// Based in Philippines · Available for roles
Focused, honest, and actively building depth in each tool.
How I took sensor data stored in SQL Server, built a flat table schema, wrote DAX measures, and created a live Power BI report that tracks plant health in real time.
A complete end-to-end pipeline — from a raw 9,994-row Kaggle CSV through Python cleaning, star schema design, to an interactive Power BI dashboard. Part 1 of 4.
A complete end-to-end pipeline — from a raw 9,994-row Kaggle CSV through Python cleaning, star schema design, to an interactive Power BI dashboard. Part 2 of 4.
...