Power BI & SQL Projects.

Plant Wilting Dashboard
Project 1 — Power BI Dashboard
Power BI SQL Server DAX Flat Table Data Modeling

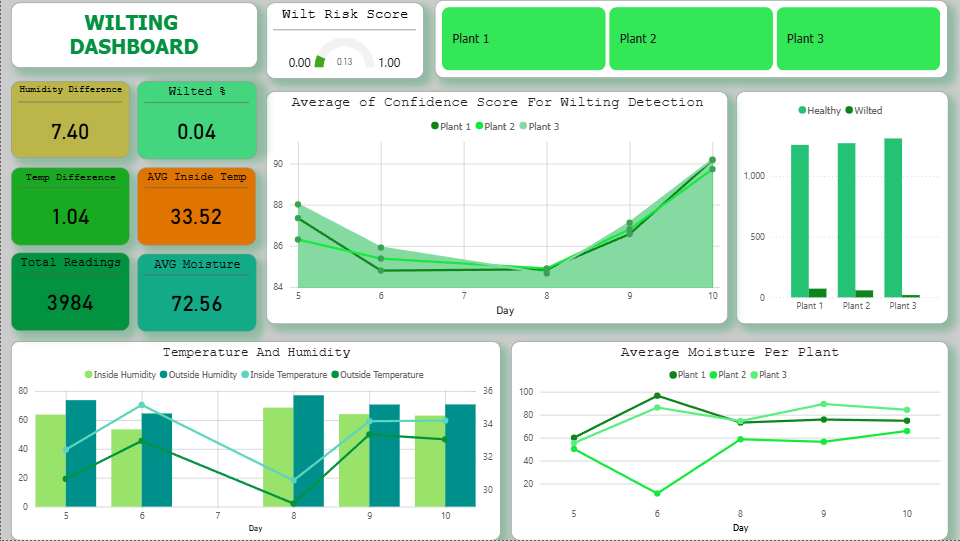
My First End-to-End Power BI Dashboard: Plant Wilting Detection

How I took IoT sensor data already stored in SQL Server, customized SQL query to extract and transform the data for analysis, wrote DAX measures for wilt risk scoring, wilt percentage, and built a dashboard that tracks plant health across three specimens in real time. A project built to learn, not to impress — and what I'd do differently next time.

Sales Analytics Dashboard
Project 2 — Sales & Demand Analytics · Part 1 of 4
Power BI SQL Server Python Star Schema DAX Descriptive

From Raw CSV to Professional Dashboard: Building a Sales Analytics Pipeline

A complete end-to-end sales analytics pipeline — from a raw 9,994-row Kaggle CSV, through Python data cleaning, star schema design in SQL Server, to an interactive Power BI dashboard. Part 1 of 4: Descriptive Analysis. What happened? $2.30M revenue, 12.47% profit margin, and a Q4 spike every single year.

Sales Analytics Dashboard
Project 3 — Sales & Demand Analytics · Part 2 of 4
Power BI SQL Server Python Star Schema DAX Diagnostic

From Raw CSV to Professional Dashboard: Building a Sales Analytics Pipeline

A complete end-to-end sales analytics pipeline — from a raw 9,994-row Kaggle CSV, through Python data cleaning, star schema design in SQL Server, to an interactive Power BI dashboard. Part 2 of 4: Descriptive Analysis. What happened? $2.30M revenue, 12.47% profit margin, and a Q4 spike every single year.

Tags
Power BI SQL Server Python DAX Excel Star Schema KPI Dashboard Descriptive pyodbc
Author
MJM
Mark John Merana
Junior Data Analyst

Specializing in Power BI and SQL Server. Building real projects and learning out loud.

About Me